A Gantt chart is a type of bar chart that illustrates a project schedule and shows the dependency relationships between activities and current schedule status. In simpler words, Gantt charts are a visual view of tasks displayed against time. They represent critical information such as who is assigned to what, duration of tasks, and overlapping activities in a project.
All in all, Gantt charts are the perfect allies for planning, scheduling, and managing a project.
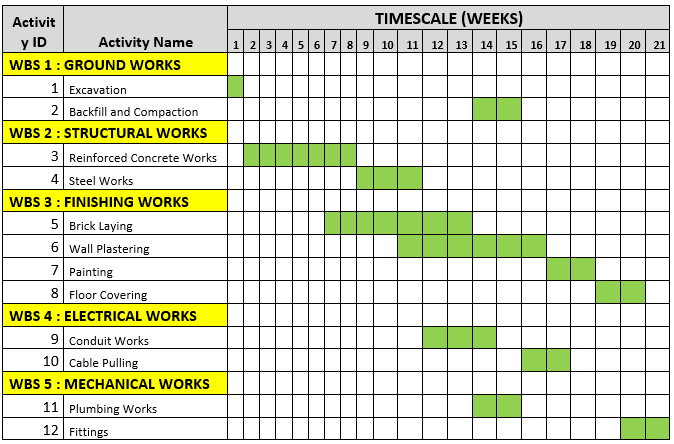
Preparing a Gantt Chart consists of five steps:
1. Define the time range
Your Gantt chart should be a project with a start and end date. Think of this chart as a way to represent your project over a timeline—your timeline needs a beginning and end point.
2. Add tasks with start and end dates
In order to effectively visualize your to-dos, make sure each individual task has a specified beginning and end date—this way they can be easily visualized on a bar chart.
3. Clarify dependencies.
With large projects, it’s natural to have some tasks that can’t get started until other tasks are complete. To keep the project running smoothly, and every team on the same page, you can visualize dependencies between tasks in your Gantt chart.
4. Pinpoint milestones.
Unlike most tasks in a Gantt chart, milestones are fixed points in time. Think of them as checkpoints to signify that large pieces of work are complete. They help your team know what to prioritize, and can be great moments of celebration when they’re completed.
5. Modify work as plans change
Plans will inevitably change, which is why your Gantt chart software should be able to adapt to your needs. That way, you can always keep your project on track, even as plans shift.
There are many Softwares available for Gantt Chart preparation. However it can also be done using MS Excel or even manually by using Graph papers.
Gantt Chart technique offers many positives. When you set up a Gantt chart, you need to think through all of the tasks involved in your project. As part of this process, you’ll work out who will be responsible for each task, how long each task will take, and what problems your team may encounter. This also helps you work out practical aspects of a project, such as the minimum time it will take to deliver, and which tasks need to be completed before others can start.
You can use this technique to keep your team and stakeholders informed of progress. Simply update the chart to show schedule changes and their implications, or use it to communicate that key tasks have been completed.
On the flip side, it takes more time consuming to set up than conventional planning. It becomes difficult to manage the project in the same place you planned it and therefore, minute level updating is required regularly. Further, adding smaller details may become messy. However despite all these cons, Gantt Chart remains a popular and productive time management technique across the world.
References:

I had come across Gantt chart while going through different charts in Google Sheets. However, I hadn’t explored them. Through this article, I understood what it is as well as could think of a couple of scenarios where I could use them in professional and personal life.
I think adding time dimension as well as seeing different tasks parallelly in time gives a different perspective to look at the project.
While I understood the overall idea, may I suggest to add an example or two to understand the concept in a better way/see it practically?
LikeLiked by 1 person